‘Fat tails’ is a statistical term that refers to greater-than-expected probabilities of extreme values, and is used within the financial markets industry. The term also implies a strong influence of extreme observations on expected future risk. To discover more about fat tails, continue reading our helpful guide below.
Fat tails explained
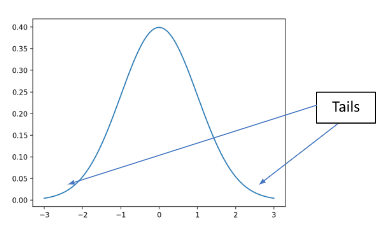
In one respect or another, everyone will have come across the concept of a bell curve, whether it’s a distribution of height, intelligence, or any other metric with an upper and lower limit. As per the illustrations, the average is the most common and sits in the middle of the graph.
 Fat tails are present in many of these typical distributions, but they’re often ignored or dismissed as anomalies. The best way to visualise what a fat tail is, is to imagine that the small segment on either side of the bell curve is a tail. Therefore, a fat tail is a distribution that is more one sided than the symmetrical graph above.
Stocks and portfolios
Why is this at all relevant? Imagine a portfolio of stocks.
Most of the returns within the portfolio will be average when compared to their sector and geographical location.
Some of the companies may go out of business. At which point, their share price would reduce to zero.
However, some will have the potential for massively outsized returns beyond any measure of a “normal” distribution curve.
At Acumen, we regularly talk about the companies that are unsuccessful being outweighed by those that continue to grow. This is definitely true and good long-term returns are often dependent on this very fact.
However, portfolio outperformance is almost always determined by “fat tails”, i.e. those companies that grow exponentially.
For example, the S&P 500 (the index of 500 separate companies listed in the United States of America) is commonly used as an example of US markets as a whole.
According to BMO, 41% of the returns for the S&P 500 since 2015 have been caused by five companies: Facebook, Amazon, Apple, Microsoft and Google.
Since IPO, these companies have returned the following to reach their all-time high:
Facebook = 880%
Amazon = 175,500%
Apple = 136,600%
Microsoft = 346,600%
Google = 5,345%
The difficulty is, no one can be sure which companies will provide the majority of future growth. If they could, they’d likely become very rich fairly easily.
If an investor selects a handful of individual companies that prove to be duds, then there is a real risk of losses.
So, how can we capture the great positive effects of fat tails, at the same time ensuring that their positive effects help balance the overall risk? The answer is diversification.
The last six months have shown us all that we don’t know what uncertainties will prevail within the stock market. Diversification allows you to ignore the companies that don’t work, benefit from the “stalwart” steady growers and enjoy the outsized performance of those positive fat tails.
This is why our investment philosophy at Acumen Financial Partnership has become pertinently focused on selecting the best Multi-Asset portfolios the market has to offer.
Contact Acumen
If any of the above has prompted any questions, please feel free to get in touch with your adviser at Acumen.
Additionally, feel free to send your queries to [email protected] where we will pick them up and answer any questions you may have.
Related Articles
-
Pensions
 March 24, 2015
Government allows savers to sell annuities
With the recent welcome announcement that savers will be allowed to sell their annuities as of next .... -
Investments
 April 28, 2015
Investing in your children’s future
Several financial products enable parents and carers to invest tax efficiently for children. In this.... -
Investments
 August 18, 2015
Financial planning advice essentials
Some interesting figures have emerged recently from Ipsos Mori and King's College London suggesting ....

